Measure the Measurers
In August 2011, a government Stat Director was called into a meeting with a heavyweight senior leader in the organization, who had no problem bluntly speaking his mind. “I want to Stat the Stat program,” the senior leader said with unmistakable seriousness. “It’s a waste of my time, my staff’s time, and I’m not clear what we are getting out of it.” His request, while difficult to swallow for the Stat Director, was completely appropriate. Within three months, the Stat program held its first Stat . . . about itself – and every session thereafter ended with a one-question survey for all participants: was this worth your time? The answer: usually it was, but sometimes it wasn’t.
Performance analytics and management are not easy. They require participation from large sections of organizations. They involve cumbersome reporting processes. They make people uneasy and risk eroding trust. They use math and statistics, which most people try and avoid. They’re stressful. They’re seen as ancillary to the core services governments provide. And they take time - our most valuable and scarcest commodity.
If government employees are expected to participate in performance analytics and management, then those responsible must continuously communicate why it is still worth their time. It’s not easy, but there are a few simple places to start.
The Center for Government Excellence at Johns Hopkins University developed this guide to help the governments figure out how to measure the measurers. It includes tips and advice for establishing metrics that raise a mirror to performance practices and reflect back the value added or lost along the way.
- Measure the Fundamentals
- Get in the Weeds
- Get out of the Weeds
- Make It Worth Their Time
- Track the Actions
- Track the Traffic
- Mind the GAAP
Measure the Fundamentals
Government’s exist to protect the governed and set the conditions for citizens to thrive. Therefore, no matter what your particular government cares about or points its resources toward, there are a few fundamental measures that should always be trending in a favorable direction.
- Are more people choosing to live in your jurisdiction? Governments are inherently place-based, so a key performance objective is to make your particular place as desirable and inhabitable as possible to current and potential residents. If net population is on the rise, then your jurisdictions is doing something right.
- Do more people want to work for your government than want to leave it? A little attrition is normal, but attrition that outpaces applications is a sign your government is not performing at peak potential.
- Is the economy in your jurisdiction providing adequate opportunities to those who need them? Is employment increasing? Is income increasing? Are incomes keeping pace with prices? Is a rising economic tide raising all ships, or is the income gap widening? The answers to these questions are critical to understanding whether your jurisdiction is making economic progress and highlight how performance analytics and management might be able to help.
- Are people in your jurisdiction living healthy, “normal” lives? The average life expectancy in the United States is 78 years and the leading cause of death is “diseases of the heart.” Is that true for your jurisdiction? Are your residents better or worse off than national norms? Is violent crime higher or lower than it used to be? If your jurisdiction deviates from national norms in concerning ways, then performance analytics and management have more to contribute.
- Are children learning? A society is only as good as its next generation, so jurisdictions should always monitor whether those coming into this world are prepared to inherit it. Education data is widely available, and even if your government doesn’t control education – it impacts (or is impacted by) education.
These are a few examples of measures that can be used to measure the measurers. If performance analytics and management are doing their jobs, then they should ultimately be impacting metrics like these. If these metrics aren’t moving, then there is more to contribute.
Get in the Weeds
One thing every performance management program usually has is performance measures or metrics. And performance teams should constantly understand the status of those metrics. When the measurers are asked whether their “measurement” matters – they should be able to cite concrete examples of successes and challenges based on the measures being tracked.
What is happening to the homicide rate? How has attrition changed in the last quarter? What percentage of new hires are on-boarded within 80 days of application? What is happening with fire fatalities? Test scores? Enrollment? Home prices? Unemployment? HIV/AIDS Rates? Incarceration rates? Petty crime?
Measurers should know the answers to these questions or at least have them at their fingertips. After all, the measurers ask others to report these statistics – so it’s only fair to read them and understand how performance is trending.
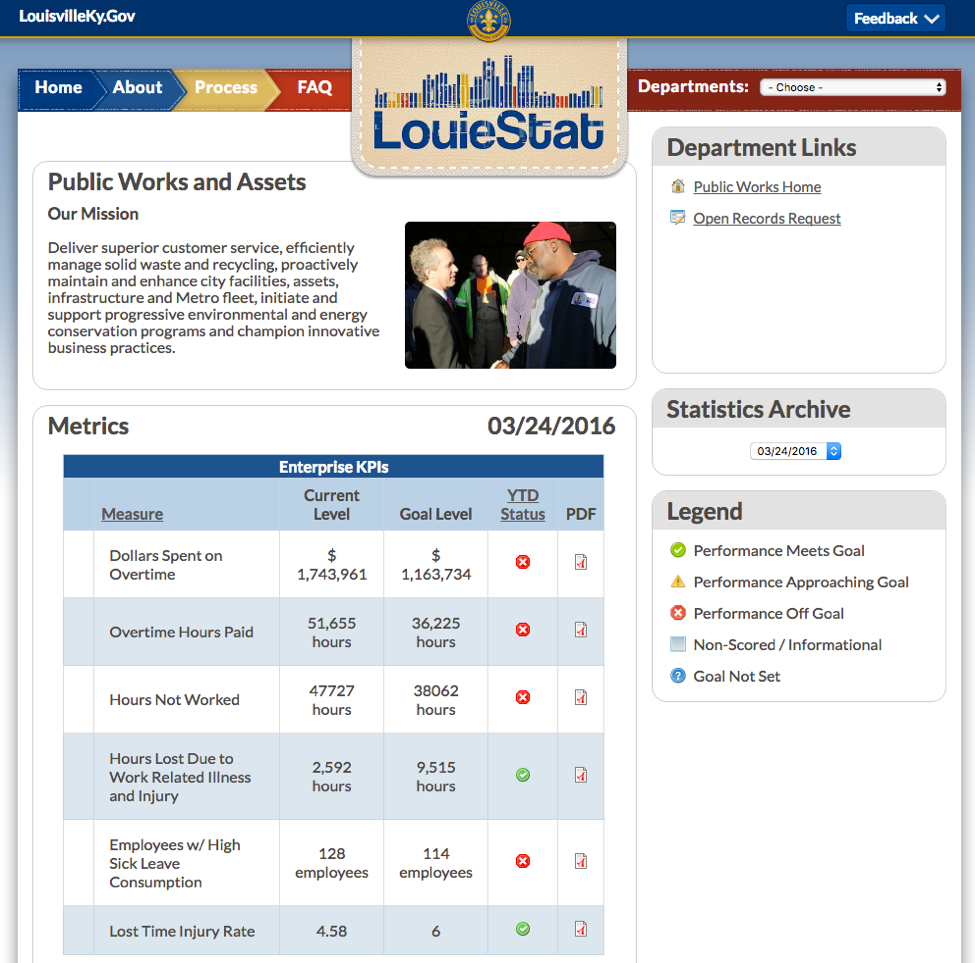
In Louisville, KY, the Office of Performance Improvement (OPI), established in January 2012, is helping the Mayor answer three fundamental questions: what are the key services metro government performs; how well are they performing, and how can they perform better? The identification, tracking and analysis of the most important metrics for each department, called Key Performance Indicators or KPIs for short, helps Louisville Metro Government Spot areas of weakness, where we are not delivering the best services or results possible; Make data-driven decisions regarding where and how to best allocate resources, and evaluate the true impact and effectiveness of the work being done across Metro Government. One way OPI holds itself accountable is to publish those KPIs right on its website, making it clear how each department is performing on the things that matter most. Viewers can simply glance and see whether performance is meeting, approaching or falling short of its goal.
Get out of the Weeds
Understanding performance at the micro level is important, but understanding it at the macro level is equally critical. There is likely a short list of outcomes your government’s leaders are trying to influence while they are in office, so knowing about performance against those outcomes is critical when the measurers get measured.
For many local jurisdictions, safer streets and communities are top priorities, so being able to cite progress against high-level metrics related to public safety is how the measurers know whether they are having an impact on the bottom line. After all, if a year of COMPStat sessions result in higher crime rates, then it is legitimate to question COMPStat’s focus and contribution. Perhaps the measurers are focusing the organization on the wrong things.
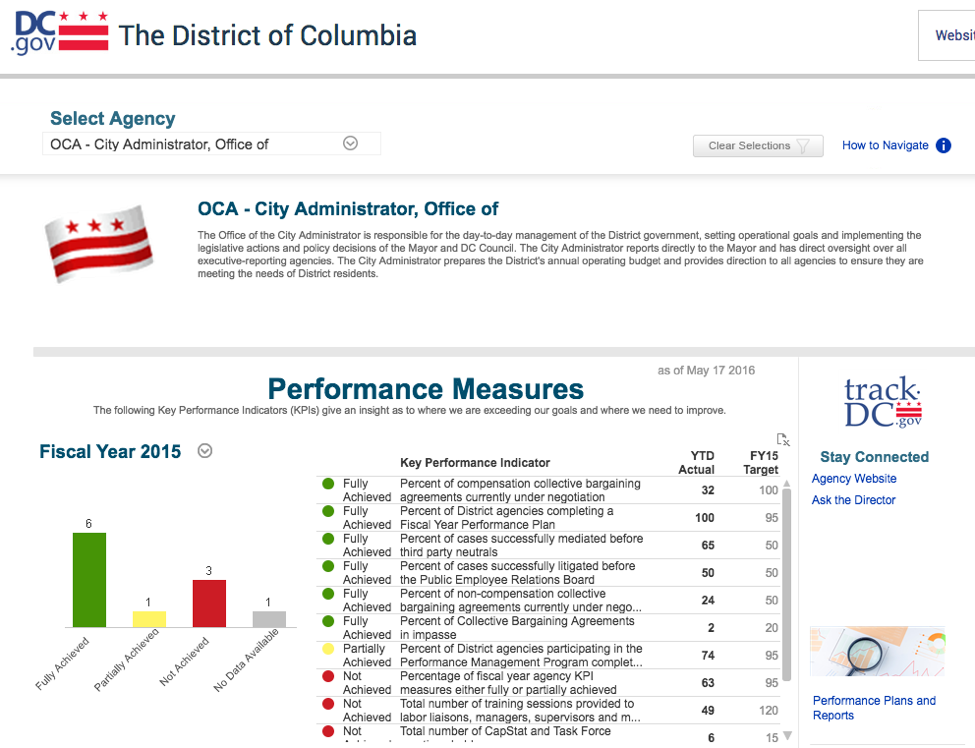
One tactic used by many governments is to use composite measures, multiple measures rolled up into one. An example is “the percent of key performance indicators on track or within the acceptable range of their target.” For example, the Office of the City Administrator in Washington, DC tracks the percent of Fiscal Year agency Key Performance Indicators (KPIs) either fully or partially achieved. Composite measures are not without controversy. They often mask underlying dynamics, hide important problem, and park key progress in the shadows – but they have their place in measuring the measurers.
Make It Worth Their Time
There is one commodity performance measurers demand even more than data, and that’s time. Collecting data takes time. Explaining it takes time. Analysis takes time. Socializing questions and findings takes time. Meetings take time. Presentations take time. Reporting takes time. Even taking action takes time. Because so much of the performance process demands so much of people’s time – asking whether the “juice was worth the squeeze” can be a very simple but important question.
One approach is to simply ask, in an anonymous electronic survey (not a show of hands): Was this worth your time? It does not have to be more complicated than that. The anonymity ensures people feel safe being candid. The brevity increases the chances they will actually answer the question. If you want more info, offer them a chance to submit comments explaining why it was or wasn’t worth their time. The insights might surprise you.
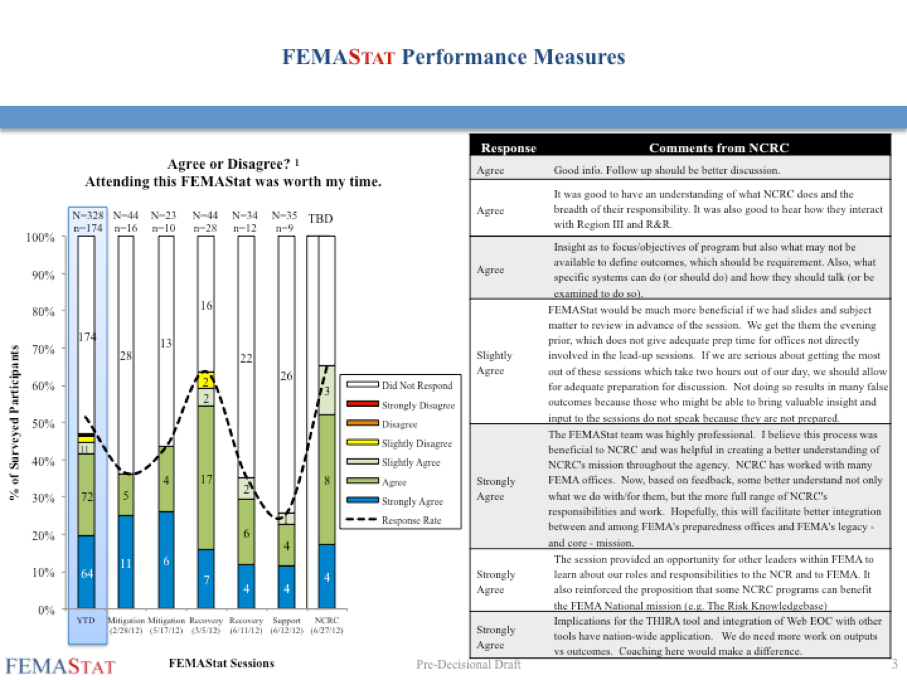
Once they respond, be transparent about the answers you get. If people see the measurers listening and adapting their practices and processes based on direct feedback, they are more likely to be honest and provide more feedback in the future. The example below is the opening slide for every FEMAStat session at the Federal Emergency Management Agency. It demonstrates the Enterprise Analytics Division is serious about its own performance and course correcting where appropriate.
Track the Actions
Strong performance analytics and management programs result in concrete actions based on useful intelligence. People should leave every data-infused meeting with a clearer list of strategies, tactics, and actions they want to take to move the needle. It isn’t necessary to track every action anyone agrees to, but the big ones deserve special attention.
Stat programs are an excellent place to track actions. Measurers usually leave those meetings with a list of actions agreed to by senior executives. They are usually assigned deadlines and departmental owners. With those three data points alone, the measurers can build ongoing reports about the status of those assigned actions over time.
It is not necessary to micromanage the actions in order to track them. The measurers simply need to check in with the action owners on a periodic basis to find out which of the following status categories are most applicable:
- Incomplete – Not Yet Due
- Incomplete – Overdue
- Completed – On Time
- Completed – After Deadline
- Under Review (the process during which the measurers determine whether the action is truly complete based on the deliverables submitted)
- Overtaken by Events (OBE) (something happened that makes this action irrelevant)
- Merged (with another action)
- On Hold (for some reason, it does not make sense to move forward with this action at this time, perhaps it is dependent on something else happening first)
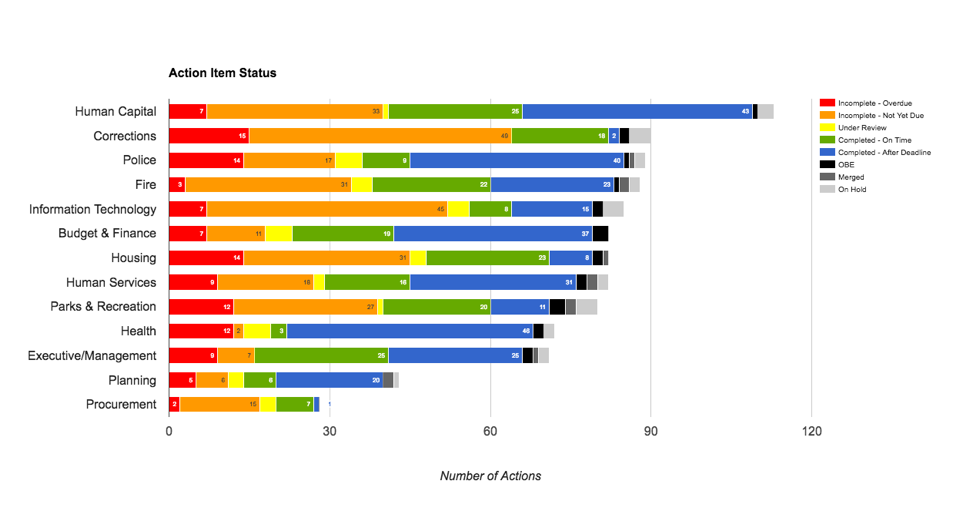
These categories are not perfect. (No categories are). But they provide a consistent way of viewing the status of action items over time. Building a spreadsheet or database that tracks these actions can enable an analysis capable of answering questions like:
- Is there unnecessary or unexplainable asymmetry in who actions are getting assigned to?
- Is there one action owner holding up a large portion of progress on actions?
- Are the deadlines we are assigning reasonable?
- Are we reviewing the deliverables quickly enough?
Track the Traffic
One measure of the measurers success is whether they are attracting attention to performance and analysis inside and outside the organization. To that end, web traffic for all performance-related pages should be regularly monitored for trends in page views, unique visitors, time on page, bounce rates, and other meaningful measures of interest.
Understanding the traffic patterns helps measurers understand what content of greatest interest to stakeholders and what potentially useful content is getting buried and going unseen.
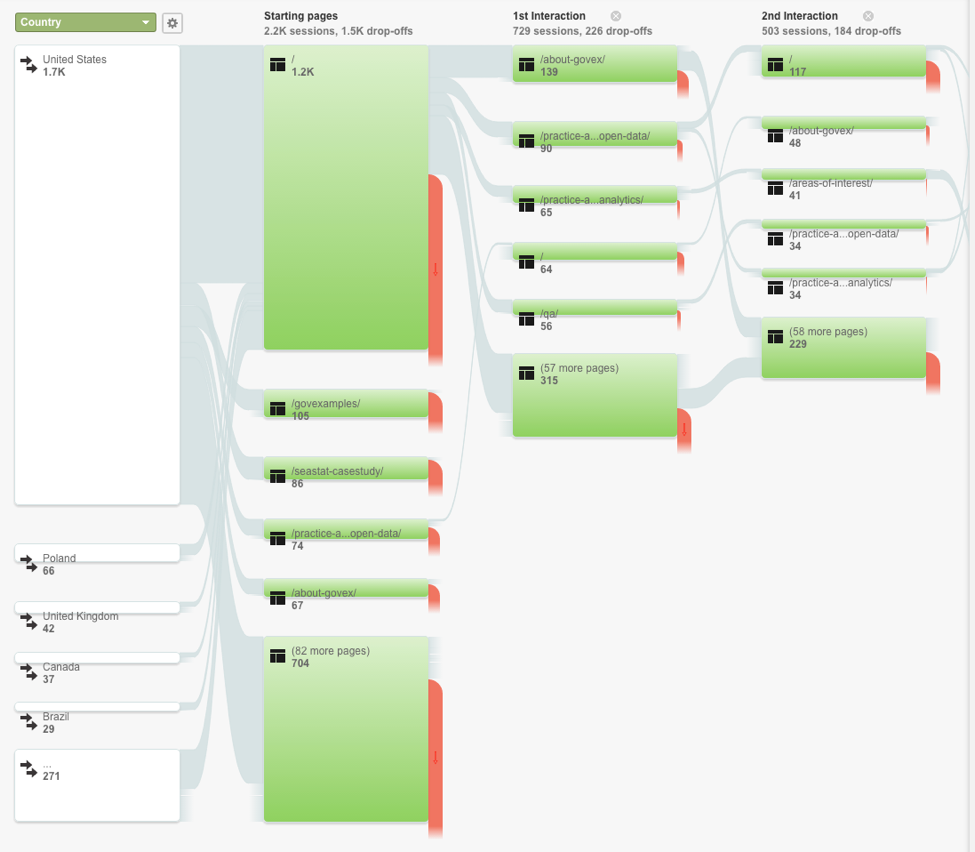
One of the most underutilized features of Google Analytics is the Users Flow diagram, which is a visual representation of the paths users take through an organization’s web site. The diagram starts by showing users’ arrival from the source, then follows them as they navigate through the various pages and eventually exit the website. The report lets you compare traffic volumes from different sources, examine traffic patterns, and troubleshoot paths that aren’t yielding strong engagement where you want it most.
Mind the GAAP
Bad performance often lands itself on the pages of an internal audit or in a qualified opinion on an auditor’s Comprehensive Annual Financial Report (CAFR). For the federal government, the Government Accountability Office (GAO) and the Congressional Budget Office (CBO) routinely publish findings and recommendations for performance improvement. Offices of Inspectors General (OIG) across the country are busy issuing similar findings about governments could be managing resources more efficiently, effectively, and fairly.
To measure whether the measurers are having an impact on overall performance of the organization, audit findings can be an incredible resource. Is the government seeing fewer audit findings than before? Are qualified financial opinions becoming less frequent? Are there important changes in the types of findings auditors are citing in their reports? Though they are usually lagging indicators, they are nonetheless useful in understanding whether the measurement is starting to matter.