Building Strong Performance Measures
In previous chapters, we described what a performance measure is, described different types of performance measures, explained the characteristics of a good measure, and listed some common mistakes. But how do you come up with a strong performance measure in the first place? The goal of this chapter is to explain the various routes your organization can take to construct meaningful measures that matter.
There are basically three ways to build a strong performance measure and all of them are valid approaches:
- Copy it: Use a measure you like from a peer organization
- Construct it: Build it from the ground up like a construction project
- Back into it: Reverse engineer it through logic modeling
Copy It
Performance measurement is not new and it is not rocket science. Chances are that someone has already asked and answered the question: How do we want to measure progress on _? So the first place to start is by scanning the known environment of your peer organizations and governments.
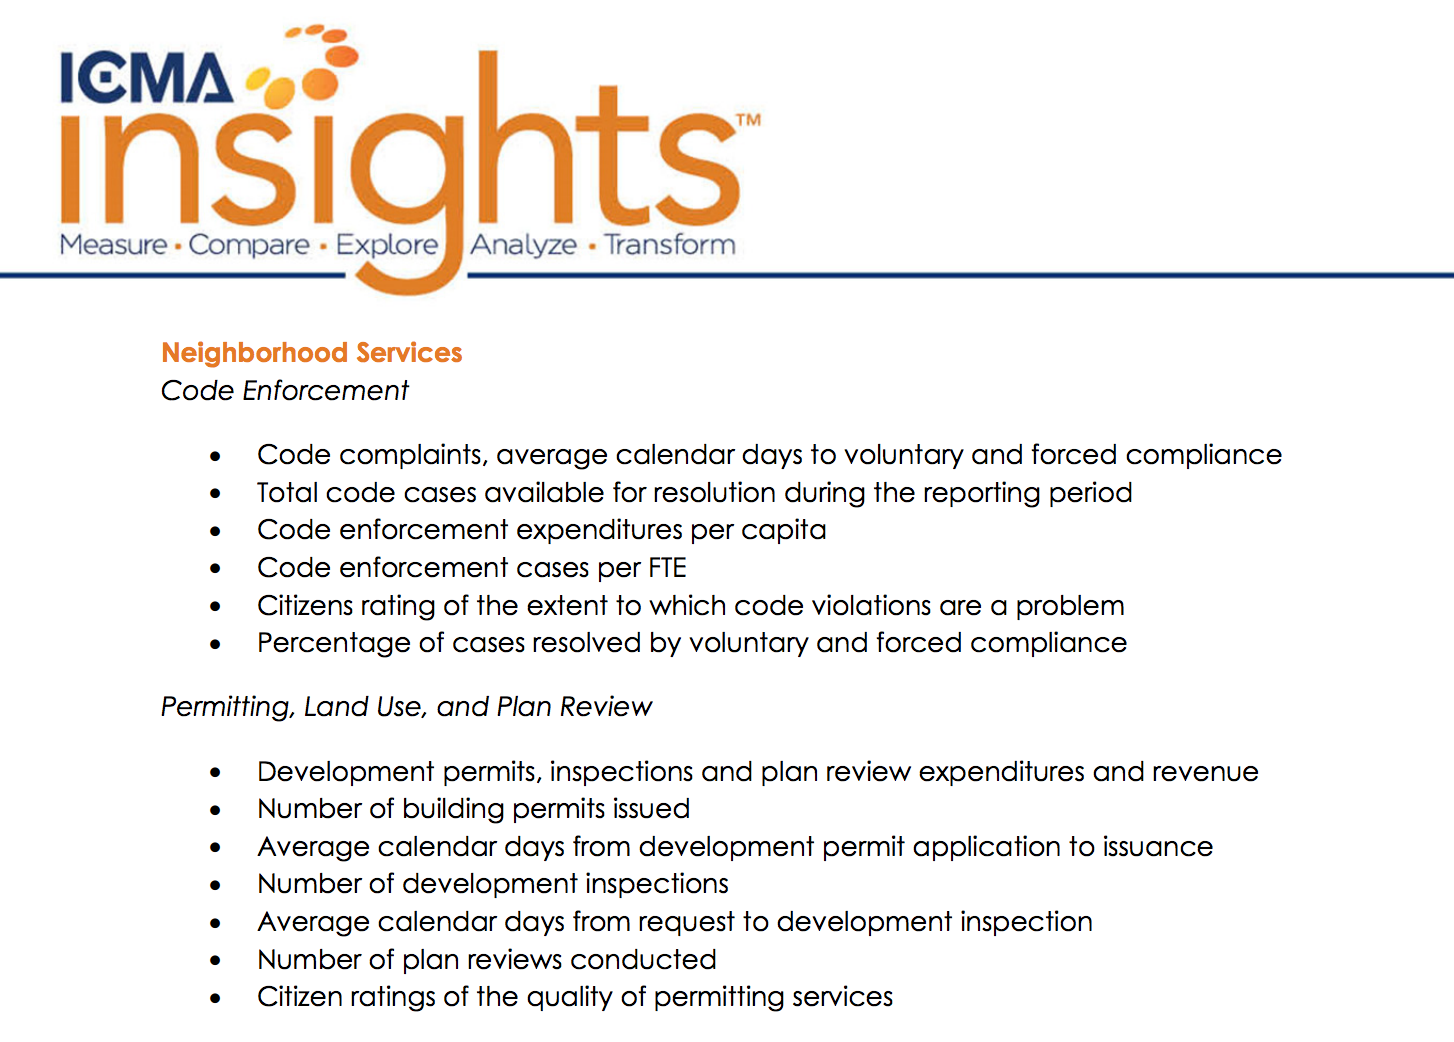
A good place to start is the International City & County Managers Association (ICMA) Insights Program. The ICMA maintains a “core set of well-defined and comparable input, output, and outcome measures on a dynamic software platform that allows communities to easily collect, clean, report, benchmark, and analyze their data.” To truly benefit from their database, you have to be a paying customer, but the ICMA makes the basic measures they are tracking publicly available, so take a look and see if any of the existing measures resonate with your performance team and program experts.
The Community Indicators Consortium (CIC) seeks to bridge the gap between community indicators and performance measurement, providing ways for community groups and governments to coordinate efforts and jointly enhance knowledge about the use of indicators to leverage positive change. The CIC provides two resources which may be helpful as you look for the right measures:
- The Indicator Projects Database is a searchable selection of indicator projects managed at the community level. The CIC does not endorse any projects and the information is generated by the projects themselves. The CIC keeps the list current by regularly asking projects to update its page.
- The Indicator Resources Database is a wide range of knowledge resources designed to advance the work of CIC members and others in the field. It includes publications, presentations, reports generated by indicators projects, websites, webinar archives, conference presentations, and many other items relevant to the field.
Perhaps the best way to find performance measures worth “stealing” is to simply peruse the performance management websites of other cities. Here are a few examples:
- Anchorage, AK: publishes Performance Value Results which show key performance measures and how the municipality is performing against them.
- Boston, MA: lets users interact with its performance measures on its Boston About Results page.
- Charlotte, NC: publishes an annual report based on its balanced scorecard approach to performance management, which shows its measures in strategic groupings.
- Chattanooga, TN: has a performance dashboard called ChattaData, which groups performance measures into strategic categories.
- Washington, DC: publishes all of its performance measures as open data.
- El Paso, TX: publishes annual reports on its progress against its strategic plan for all eight goals.
- Kansas City, MO: has a performance dashboard called KCStat, which groups performance measures into strategic categories.
- Louisville, KY: by clicking on any agency name on its LouieStat site, you can see the performance measures for each agency.
- San Francisco, CA: has Performance Scorecards, which group measures into key priority categories.
- Scottsdale, AZ: publishes quarterly performance reports, which show measures and how they are trending against targets.
To make life even easier, GovEx compiled a Catalogue of Performance Indicators and Metrics with more than 2,000 examples from cities across the country.
Construct It
Building a performance measure from scratch requires an appreciation for the fact that we don’t just measure for sake of measuring. Performance measures exist in context and are meant to speak to the overarching achievement of a goal. Therefore, building them from scratch requires accounting for the entire context in which performance is being measured.
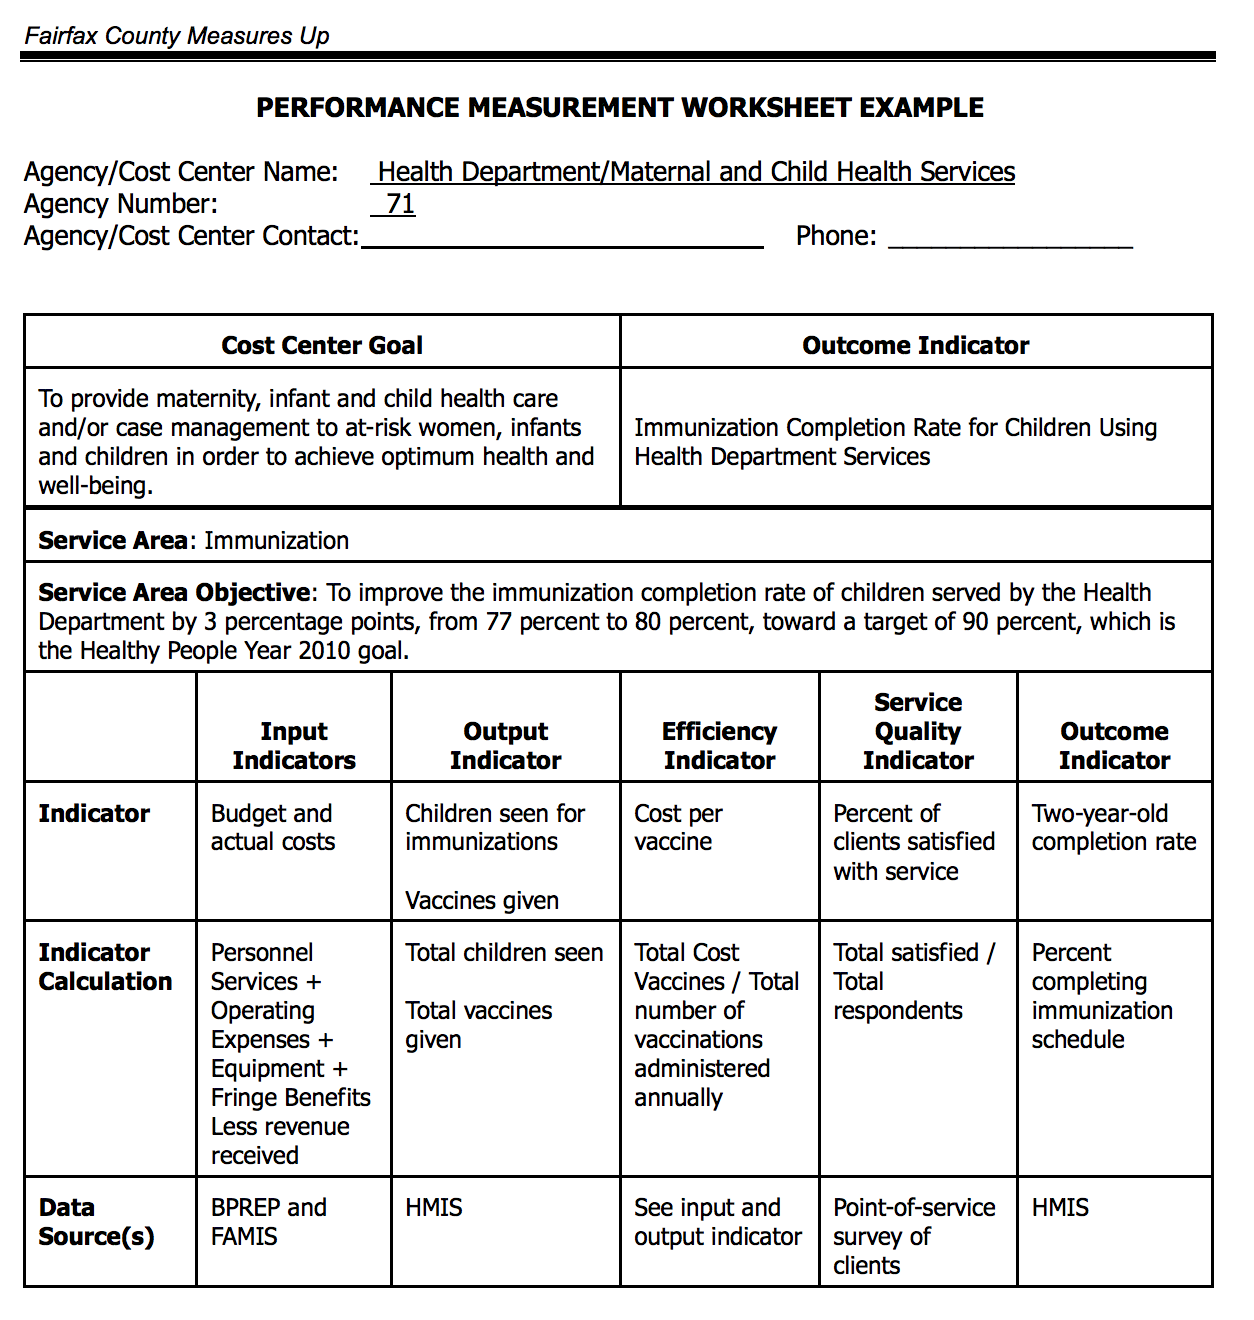
One of the best resources for constructing performance measurement in context is published by Department of Management and Budget in Fairfax County, VA. The County’s Basic Manual for Performance Measurement is one of the most comprehensive, timeless, and easy-to-use resources out there. For example, the guide includes sample worksheets and examples to help construct a healthy suite of performance indicators or metrics.
For more advanced organizations, Fairfax also publishes a Guide to Data Collection (written before open data was a thing, but still very relevant content), a Surveying for Customer Satisfaction Manual, and an advanced guide called Managing for Results.
In Oregon, the City of Portland publishes a Performance Management Manual, which includes guidelines for city employees on how to select or create performance measures. Multnomah County publishes a Performance Management Manual, which includes logic modeling (see next section).
Other notable resources for constructing performance measures from scratch include:
- A professor at the University of Wisconsin published a performance measurement guide for local Wisconsin government's in 2009.
- The State of Texas has a Guide to Performance Measure Management, published in 2012.
- The National Performance Management Advisory Commission published a Performance Management Framework for State and Local Government: From Measurement and Reporting to Managing and Improving.
Back Into It
Across almost all of the resources mentioned above, you will see mention of the phrase “logic modeling.” Logic modeling can be a very useful tool for finding the right performance measures and there is a wealth of published guidance on how to construct and execute a logic model.
A logic model usually begins with a stated desired outcome and then works backward by making a graphical depiction of the resources, activities, and outputs needed to achieve that outcome. By beginning with the end in mind, organizations can ask themselves a series of questions like until they’ve linked resources to desired activities and outcomes:
- What outcome are we trying to influence?
- What do we actually do or produce that influences that outcome?
- What would we measure to know whether our work was influencing that outcome?
The most comprehensive tool for understanding logic modeling was written in 2004 by the Kellogg Foundation. It is called a Logic Model Development Guide. GovEx has published a highly simplified version of it on our Performance Alignment Guide. It is everything listed on the right side of the guide. In short, you do the following during the process of logic modeling:
- Define what resources/inputs you can leverage
- Make a list of all the activities/programs that consume resources
- Link those activities/programs to their outputs
- Define the link between outputs and the behavior you are trying to influence
- Articulate what a positive result/outcome looks like